Revenue Numbers for Portal:
Gross Receipts
These are funds that the portal collects and that flow through the portal's bank account. We began originating ACH payments DOTAX (Tax payments) in 2012 and (Unemployment Insurance Taxes) in 2013 directly to the state's bank account, so those funds are not included in gross receipts as of 2012 and 2013, respectively.
| 2010 | 2011 | 2012 | 2013 | 2014 | |
|---|---|---|---|---|---|
| AG | 1,191,554 | 1,254,234 | 1,227,582 | 1,315,954 | 1,860,216 |
| DBEDT | 15,700 | 17,328 | 156,846 | 67,909 | 153,938 |
| DBF | 2,800 | 30,000 | 14,273 | 6,436 | 30,106 |
| DCCA | 11,790,802 | 13,022,353 | 14,434,039 | 12,452,572 | 15,956,695 |
| DLIR | 45,712,079 | 82,436,800 | 95,040,507 | 547,105 | 702,499 |
| DLNR | 1,488,804 | 2,967,267 | 2,964,637 | 3,549,764 | 4,086,738 |
| DOH | 459,162 | 364,303 | 2,246,456 | 2,007,665 | 2,256,454 |
| DOT | 2,169 | 20,660 | 29,878 | 35,426 | 28,917 |
| DPS | 143,460 | 206,580 | 254,251 | 357,872 | |
| Hawaii | 6,425,809 | 9,985,318 | 11,503,982 | 14,039,721 | 18,361,138 |
| HIC | 22,994 | 26,290 | 49,967 | 45,358 | 52,910 |
| HTSB | 969,184 | 1,434,661 | 1,052,121 | 673,963 | 22,635 |
| Honolulu | 610,919 | ||||
| Judiciary | 3,842,153 | 4,706,337 | 4,849,470 | 8,040,837 | 9,038,883 |
| Kauai | 5,444,937 | 5,389,478 | 5,916,178 | 6,920,745 | 11,847,602 |
| LG | 40,975 | ||||
| Maui | 688,219 | 1,659,141 | 3,401,612 | 4,156,018 | 5,223,532 |
| OIMT | 244,786 | 559,062 | 286,095 | ||
| SPO | 51,172 | 87,498 | 137,214 | 150,436 | 380,363 |
| TAX | 673,052,534 | 880,257,379 | 1,202,291,473 | 23,365,877 | 25,219,309 |
| UH | 13,968 | -5,238 | 0 | 15,857 | |
| 751,174,041 | 1,003,797,268 | 1,345,767,601 | 78,189,098 | 96,533,652 |

Partner Revenue Collected
These are funds that were collected by the portal and disbursed to Partners. Note that in 2013 we stopped reporting the tax revenue via eCheck/ ACH in the same category as credit card and subscriber payments and added two non-revenue categories: DLIR-ACH and Tax-ACH.
| 2010 | 2011 | 2012 | 2013 | 2014 | |
|---|---|---|---|---|---|
| AG | 1,053,086 | 1,089,274 | 1,050,473 | 1,120,030 | 1,573,672 |
| DBEDT | 0 | 0 | 0 | 0 | 0 |
| DBF | 0 | 0 | 0 | 0 | 0 |
| DCCA | 10,180,098 | 11,438,611 | 12,666,895 | 10,820,257 | 13,833,266 |
| DLIR | 45,665,224 | 82,355,767 | 94,953,854 | 444,059 | 380,964 |
| DLNR | 1,138,400 | 1,772,768 | 1,989,414 | 2,523,648 | 3,033,707 |
| DOH | 330,135 | 294,879 | 1,838,429 | 1,747,311 | 1,779,663 |
| DOT | 2,020 | 19,567 | 28,108 | 33,603 | 26,715 |
| DPS | 125,886 | 181,274 | 223,068 | 319,133 | |
| Hawaii | 6,303,541 | 9,835,504 | 11,311,998 | 13,832,407 | 18,079,412 |
| HIC | 0 | 0 | 0 | 178 | 0 |
| HTSB | 820,460 | 1,250,333 | 823,220 | 592,631 | 0 |
| Honolulu | 486,877 | ||||
| Judiciary | 2,983,580 | 3,845,533 | 3,978,467 | 7,005,007 | 7,960,945 |
| Kauai | 5,365,750 | 5,317,473 | 5,844,156 | 6,836,917 | 11,746,929 |
| LG | 37,250 | ||||
| Maui | 663,605 | 1,607,174 | 3,315,724 | 4,051,951 | 5,090,256 |
| OIMT | 0 | 0 | 0 | 0 | |
| SPO | 0 | 0 | 0 | 0 | 0 |
| TAX | 672,509,479 | 879,584,772 | 1,201,442,564 | 22,277,701 | 24,065,431 |
| UH | 0 | 0 | 0 | 0 | |
| DLIR-ACH | 0 | 0 | 0 | 118,251,801 | 85,494,175 |
| Tax-ACH | 1,404,308,417 | 1,552,180,382 | |||
| 747,015,378 | 998,537,542 | 1,339,424,575 | 1,594,068,984 | 1,726,088,777 |

Tax and DLIR ACH Revenue included in new categories beginning 2013
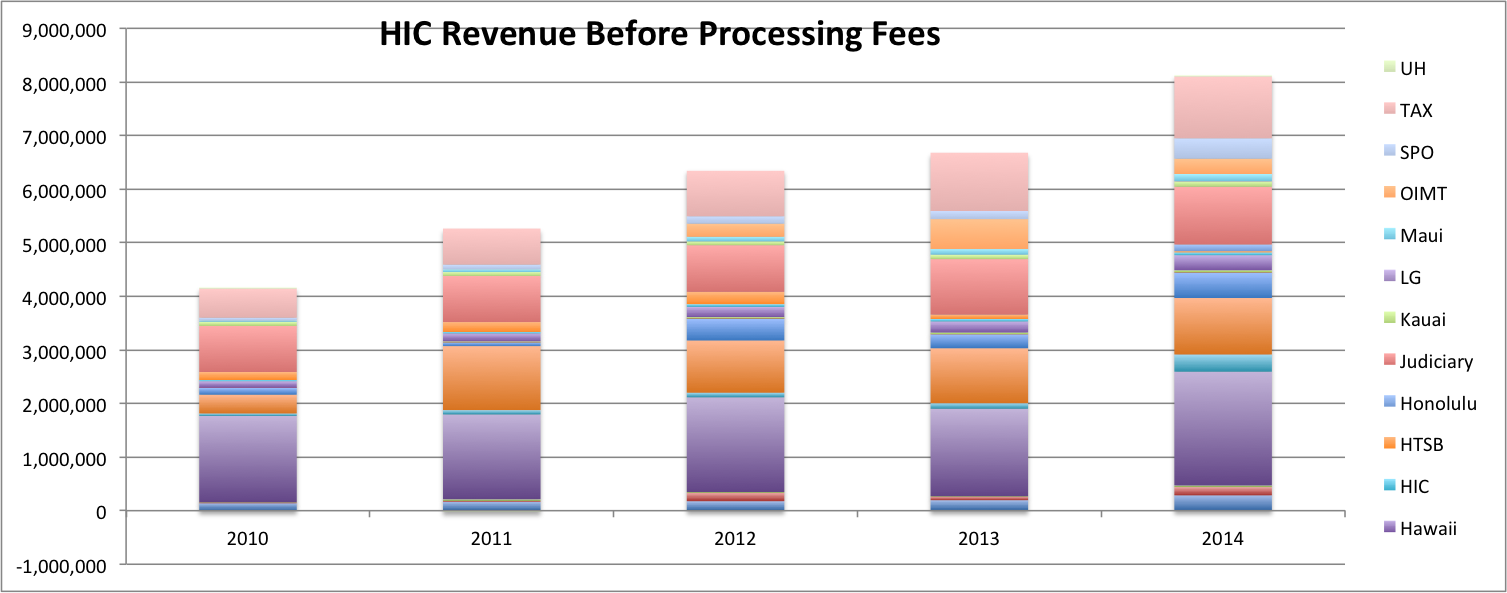
Portal Revenue Including Payment Processing Fees
This is portal revenue before the credit card merchant fees are deducted.
| 2010 | 2011 | 2012 | 2013 | 2014 | |
|---|---|---|---|---|---|
| AG | 138,468 | 164,960 | 177,109 | 195,924 | 286,544 |
| DBEDT | 15,700 | 17,328 | 156,846 | 67,909 | 153,938 |
| DBF | 2,800 | 30,000 | 14,273 | 6,436 | 30,106 |
| DCCA | 1,610,704 | 1,583,741 | 1,767,144 | 1,632,315 | 2,123,429 |
| DLIR | 46,855 | 81,033 | 86,653 | 103,047 | 321,534 |
| DLNR | 350,404 | 1,194,500 | 975,223 | 1,026,115 | 1,053,031 |
| DOH | 129,027 | 69,424 | 408,027 | 260,354 | 476,791 |
| DOT | 149 | 1,093 | 1,769 | 1,824 | 2,201 |
| DPS | 17,574 | 25,306 | 31,183 | 38,739 | |
| Hawaii | 122,268 | 149,814 | 191,984 | 207,313 | 281,726 |
| HIC | 22,994 | 26,290 | 49,967 | 45,179 | 52,910 |
| HTSB | 148,724 | 184,327 | 228,901 | 81,332 | 22,635 |
| Honolulu | 124,042 | ||||
| Judiciary | 858,573 | 860,804 | 871,003 | 1,035,830 | 1,077,938 |
| Kauai | 79,187 | 72,005 | 72,022 | 83,828 | 100,673 |
| LG | 3,725 | ||||
| Maui | 24,614 | 51,967 | 85,888 | 104,068 | 133,277 |
| OIMT | 244,786 | 559,062 | 286,095 | ||
| SPO | 51,172 | 87,498 | 137,214 | 150,436 | 380,363 |
| TAX | 543,055 | 672,607 | 848,909 | 1,088,176 | 1,153,877 |
| UH | 13,968 | -5,238 | 0 | 15,857 | |
| 4,158,662 | 5,259,726 | 6,343,026 | 6,680,332 | 8,119,432 |

Portal Merchant Fees (Credit Card Only, Does not include charge-backs, returns, or banking)
| 2010 | 2011 | 2012 | 2013 | 2014 |
|---|---|---|---|---|
| 747,490 | 895,350 | 1,049,300 | 1,055,100 | 1,271,800 |
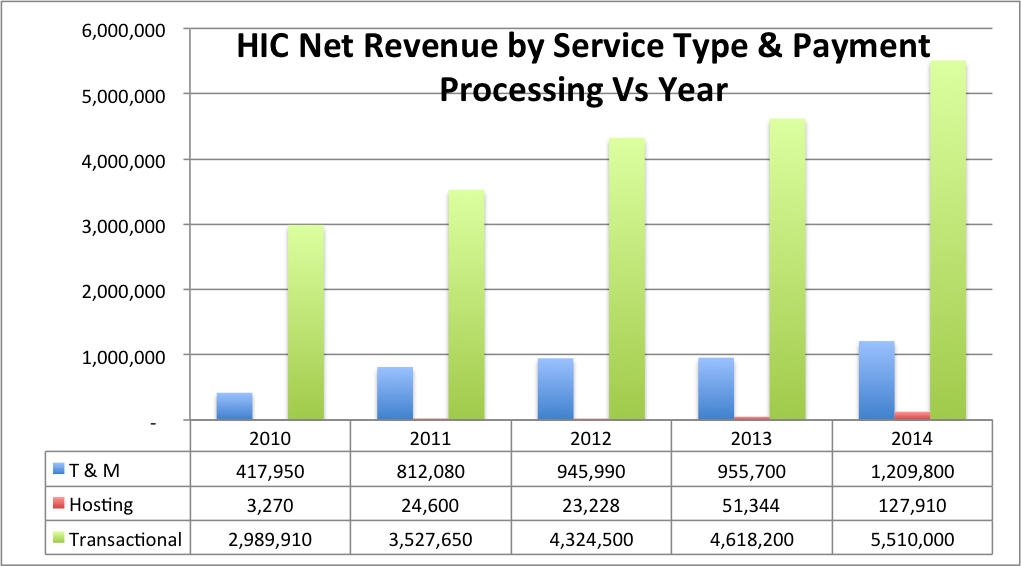
Portal Services have three categories:
T&M - Typically fixed price projects for a non-revenue or hybrid service (e.g. Vital Records, CMLS, Marriage System, Web Sites)
Hosting - We provide hosting for non-revenue services (e.g. website hosting, third party software, database replication)
Transactional / Self-Funded - Services that have a fee/payment associated that either the filer/fee-payer or the department pays to HIC.

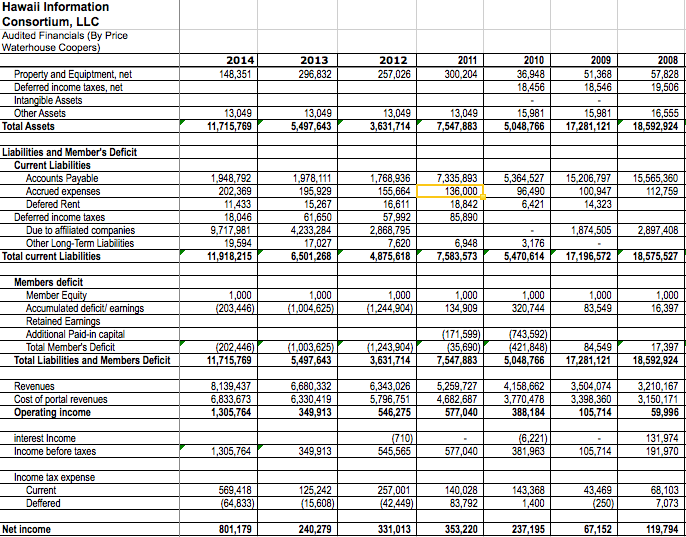
Audited Financials
The complete audited financials from 2008 - 2014
